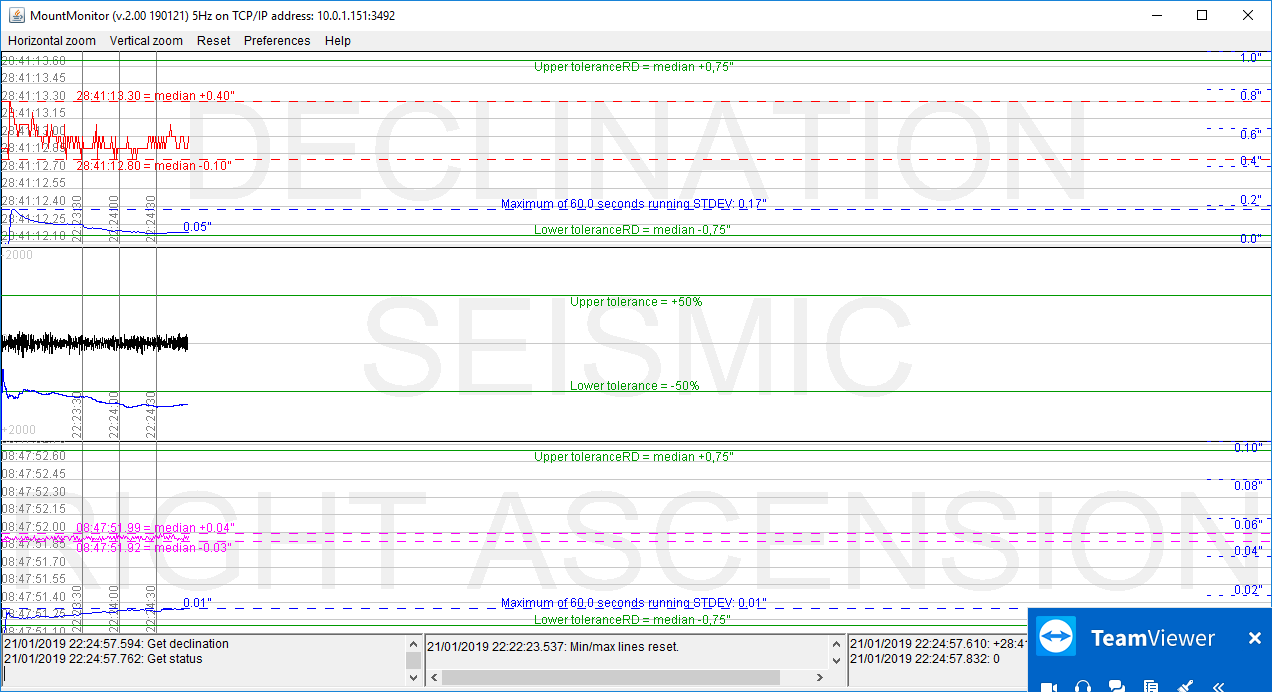
The window bar gives information on the polling frequency and ethernet address used. It would read something like "MountMonitor (v.3.00 200321) 5Hz on TCP/IP address 10.0.0.10:3492". When in stand-alone testing mode it reads "… 5Hz in test mode". In this example it is sending commands at a frequency of 5Hz, so 5 times per second, which is set in the preferences.
The menus
The menu item Horizontal zoom changes the amount of data shown along the horizontal axis. Default is 1, which means each pixel of your screen corresponds to 1 data point from your mount. "5x" means each data point requires 5 pixels of the screen. It is best to leave this on 1x. The amount of data available for the running standard deviation depends on the width of the screen and polling interval. If the combined settings result in less than 60 seconds of data in the graph, the running STDEV will not be of 60 seconds.
Menu item Vertical zoom allows to select how the vertical scale is calculated. The Data (median centred)setting zooms to the data, regardless the tolerance setting (so tolerance lines may be off screen). The median of the data is kept vertically centred. The Tolerance setting zooms to the tolerance levels, regardless the data (so data may run off screen). The median is again kept vertically centred. The Maximum (data/tolerance) option keeps both the data and tolerance lines within the screen (but then when spikes occur the rest of the data may not show enough detail). When the program runs for a prolonged time the min/max value lines may run off graph using above options. The last option Min/Max value lines allows to zoom to those lines to see their corresponding values.
In the Reset menu the option New files can be found which closes the current .log and .dat files and opens new ones. Both these files are plain ASCII and can be opened with any text editor, just like the prefs file. The fields are TAB separated so can easily be imported in spreadsheet software like Excel.
The graphs
A maximum of four graphs are drawn, the top one for RA, then one for DEC. If connected the third graph will show seismic data, while the last graph shows the performance of the mount clock in relation to the PC-clock.