|
Fast Fourier Transformation
|
|
|
Fast Fourier Transformation
|
|
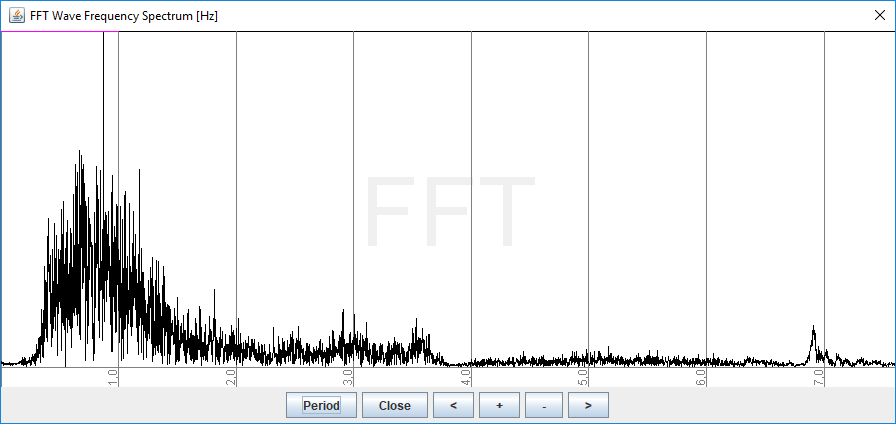 The Fast Fourier Transformation (FFT) converts the RA, DEC, and seismic data from the time domain to the frequency (upper adjacent graph) and wave period domains (lower adjacent graph). This allows to identify vibration sources based on their frequency or wave period. As the RA and DEC data are also converted the tool allows to see if there is correlation between the vibrations and mount data. In the upper right hand corner the actual data frequencies are displayed in the colours of the graphs.
 The graphs are scaled automatically to the most significant data upon opening of the FFT window. Using the + and - button the horizontal scale can be changed to zoom into or out of the data. The < and > buttons allow to shift the graph to the left or right.